MID NORTH COAST
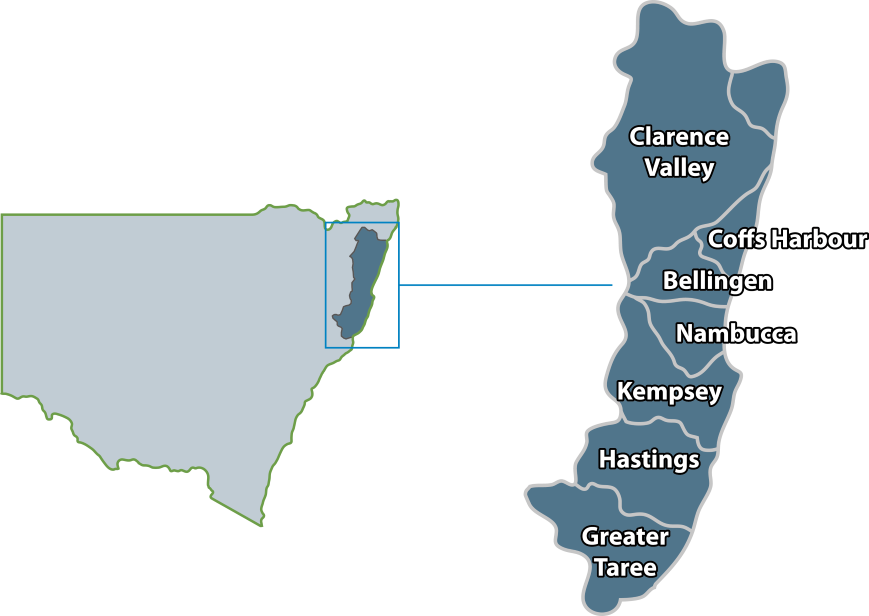
Click on local area for detailed information
Economic performance of the Mid North Coast region can be measured using 10 headline indicators (or (EPIs)
EPI 1: Population growth
Measured by the annual % change in estimated resident population
|
Population |
Annual growth |
Average annual growth |
|
2015 |
2014-15 |
2010-15 |
Bellingen |
13,010 |
0.7% |
0.2% |
Clarence Valley |
51,040 |
0.1% |
0.0% |
Coffs Harbour |
72,971 |
0.9% |
0.7% |
Greater Taree |
49,095 |
0.4% |
0.6% |
Kempsey |
29,684 |
0.2% |
0.5% |
Nambucca |
19,598 |
-0.2% |
0.5% |
Port Macquarie Hastings |
78,128 |
0.9% |
1.0% |
|
|
|
|
Mid North Coast |
313,526 |
0.5% |
0.6% |
|
|
|
|
New South Wales |
7,617,684 |
1.4% |
1.3% |
Australia |
23,777,777 |
1.4% |
1.5% |
Source: ABS
Population Growth
EPI 2: Economic growth
Measured by annual change in real Gross Regional Product
EPI 3: GRP per capita
Measured by the total GRP divided by the resident population
|
GRP ($M) |
Annual growth |
GRP per capita ($) |
|
2014/15 |
2013/14-2014/15 |
2014/15 |
Bellingen |
471.1 |
6.7% |
39,110 |
Clarence Valley |
2,370.8 |
5.0% |
44,975 |
Coffs Harbour |
3,998.6 |
5.2% |
53,855 |
Greater Taree |
1,986.7 |
4.0% |
39,628 |
Kempsey |
1,255.2 |
4.6% |
41,993 |
Nambucca |
650.2 |
4.9% |
36,046 |
Port Macquarie Hastings |
3,629.2 |
4.5% |
46,551 |
|
|
|
|
Mid North Coast |
14,361.7 |
4.8% |
45,497 |
|
|
|
|
New South Wales |
492,352.0 |
3.6% |
67,423 |
Australia |
1,583,557.0 |
1.6% |
68,978 |
Source: ABS, DEEWR, Lawrence Consulting
GRP per capita
EPI 4: Employment growth
Measured by the annual change in employed persons (residents)
EPI 5: Unemployment rate
Measured by total unemployed persons as % of labour force
|
Employed persons |
Annual growth |
Unemployment rate |
|
Mar Qtr 2016 |
yr to Mar Qtr 2016 |
Mar Qtr 2016 |
Bellingen |
5,831 |
1.4% |
5.7% |
Clarence Valley |
21,739 |
1.4% |
6.5% |
Coffs Harbour |
35,534 |
0.9% |
5.3% |
Greater Taree |
19,696 |
2.9% |
9.7% |
Kempsey |
11,125 |
2.8% |
10.1% |
Nambucca |
7,302 |
3.4% |
10.2% |
Port Macquarie Hastings |
33,810 |
3.6% |
6.4% |
|
|
|
|
Mid North Coast |
135,037 |
2.3% |
7.2% |
|
|
|
|
New South Wales |
3,747,172 |
3.3% |
5.6% |
Australia |
11,809,846 |
2.0% |
6.0% |
Source: DEEWR, Lawrence Consulting
Unemployment Rate
EPI 6: Productivity
Measures the efficiency of production within a region by dividing the total value added/GRP by employee hours worked (i.e. labour productivity)
|
Productivity level |
Annual change ($) |
Annual growth (%) |
|
2014/15 |
2013/14-2014/15 |
2013/14-2014/15 |
Bellingen |
$55.82 |
$0.59 |
1.1% |
Clarence Valley |
$57.94 |
$1.27 |
2.2% |
Coffs Harbour |
$58.09 |
$1.40 |
2.5% |
Greater Taree |
$58.57 |
$1.36 |
2.4% |
Kempsey |
$58.08 |
$1.29 |
2.3% |
Nambucca |
$59.40 |
$1.48 |
2.5% |
Port Macquarie Hastings |
$60.53 |
$1.47 |
2.5% |
|
|
|
|
Mid North Coast |
$58.71 |
$1.35 |
2.4% |
|
|
|
|
New South Wales |
$70.68 |
$1.86 |
2.7% |
Australia |
$81.55 |
$1.10 |
1.4% |
Source: ABS, Lawrence Consulting
Labour Productivity
EPI 7: Index of Economic Diversity
Measures economic diversity within a region by determining the degree to which the region’s industry mix differs from that of the nation.
When the index value is close to one, the industrial profile of a region mirrors that of the national economy and is considered more diverse
|
Index value |
Index value |
|
(Australia = 1.000) |
(New South Wales = 1.000) |
Bellingen |
0.603 |
0.623 |
Clarence Valley |
0.694 |
0.705 |
Coffs Harbour |
0.830 |
0.840 |
Greater Taree |
0.771 |
0.789 |
Kempsey |
0.735 |
0.759 |
Nambucca |
0.681 |
0.695 |
Port Macquarie Hastings |
0.678 |
0.701 |
|
|
|
Mid North Coast |
0.814 |
0.830 |
|
|
|
New South Wales |
0.980 |
1.000 |
Australia |
1.000 |
- |
Source: ABS
Index of Economic Diversity
EPI 8: Growth in dwelling approvals
Measured by annual % change in total dwelling approvals
|
Dwelling approvals |
Annual growth |
Value of non-residential approvals ($'000) |
Annual growth |
|
yr to Mar Qtr 2016 |
Bellingen |
27 |
58.8% |
752 |
-43.2% |
Clarence Valley |
208 |
65.1% |
30,665 |
472.9% |
Coffs Harbour |
417 |
29.1% |
32,877 |
0.5% |
Greater Taree |
292 |
33.3% |
9,093 |
-57.2% |
Kempsey |
117 |
53.9% |
14,916 |
-55.1% |
Nambucca |
52 |
-34.2% |
5,276 |
-54.0% |
Port Macquarie Hastings |
649 |
40.8% |
32,171 |
-54.2% |
|
|
|
|
|
Mid North Coast |
1,762 |
35.4% |
125,750 |
-28.4% |
|
|
|
|
|
New South Wales |
64,338 |
18.9% |
8,732,959 |
-8.1% |
Australia |
219,315 |
6.1% |
29,733,685 |
-0.8% |
Source: ABS
Dwelling Approvals
EPI 9: Average business turnover
Measured by the average turnover of entities whose registered place of business for GST is within the region
|
Business count |
Annual growth |
Estimated local business turnover ($M) |
Average business turnover ($'000) |
|
June 2015 |
yr to June 2015 |
2014/15 |
2014/15 |
Bellingen |
1,122 |
-1.8% |
353 |
314.7 |
Clarence Valley |
3,794 |
-2.0% |
1,297 |
341.9 |
Coffs Harbour |
5,408 |
-0.4% |
2,314 |
428.0 |
Greater Taree |
3,261 |
-0.9% |
1,221 |
374.3 |
Kempsey |
2,151 |
-1.6% |
709 |
329.8 |
Nambucca |
1,403 |
-0.6% |
445 |
317.5 |
Port Macquarie Hastings |
5,921 |
0.7% |
2,331 |
393.7 |
|
|
|
|
|
Mid North Coast |
23,060 |
-0.7% |
8,671 |
376.0 |
|
|
|
|
|
New South Wales |
696,209 |
1.5% |
291,909 |
419.3 |
Australia |
2,095,698 |
1.2% |
884,887 |
422.2 |
Source: ABS, Lawrence Consulting
Average Business Turnover
EPI 10: Per capita income
Measured by total income based on ATO returns divided by estimated resident population
|
Per capita income |
Annual growth |
Average annual growth |
|
2012/13 |
2011/12-2012/13 |
2007/08-2012/13 |
Bellingen |
$20,367 |
6.9% |
4.9% |
Clarence Valley |
$17,945 |
4.1% |
3.0% |
Coffs Harbour |
$23,358 |
7.8% |
5.9% |
Greater Taree |
$18,794 |
4.6% |
3.8% |
Kempsey |
$16,630 |
2.6% |
2.8% |
Nambucca |
$16,791 |
4.9% |
4.6% |
Port Macquarie Hastings |
$22,786 |
5.9% |
4.8% |
|
|
|
|
Mid North Coast |
$20,431 |
5.7% |
4.5% |
|
|
|
|
New South Wales |
$31,600 |
4.7% |
3.7% |
Australia |
$31,968 |
5.1% |
4.1% |
Source: ABS, Lawrence Consulting
Per capita income
Click on arrow to expand. Hover over data points in interactive graphs for actual values.
© Lawrence Consulting