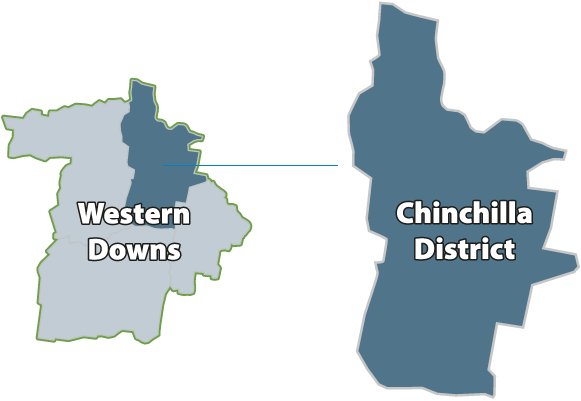
CHINCHILLA DISTRICT

Click on local area for detailed information
Economic performance of Chinchilla District can be measured using 10 headline indicators (or (EPIs)
Key Economic Performance Indicators (EPIs)
 Population
7,804 persons
(2015)
 Gross Regional Product
$1.0 billion
(2014/15)
 Labour Market
4,055 employed persons
(Mar Qtr 2016)
 Productivity
$77.74 value added/hr worked
(2014/15)
 Economic Diversity
0.212
(2011)
 Building Activity
4 dwelling approvals
(yr to Mar Qtr 2016)
 Business Numbers
1,131 businesses
(June 2015)
 Income
$33,835 per capita
(2012/13)
Click on arrow to expand. Hover over data points in interactive graphs for actual values.
For summary information on the Western Downs region and other local districts, click here
© Lawrence Consulting


 Population
