WIDE BAY-BURNETT

Wide Bay-Burnett Map North Burnett North Burnett Gympie Cherbourg South Burnett Fraser Coast
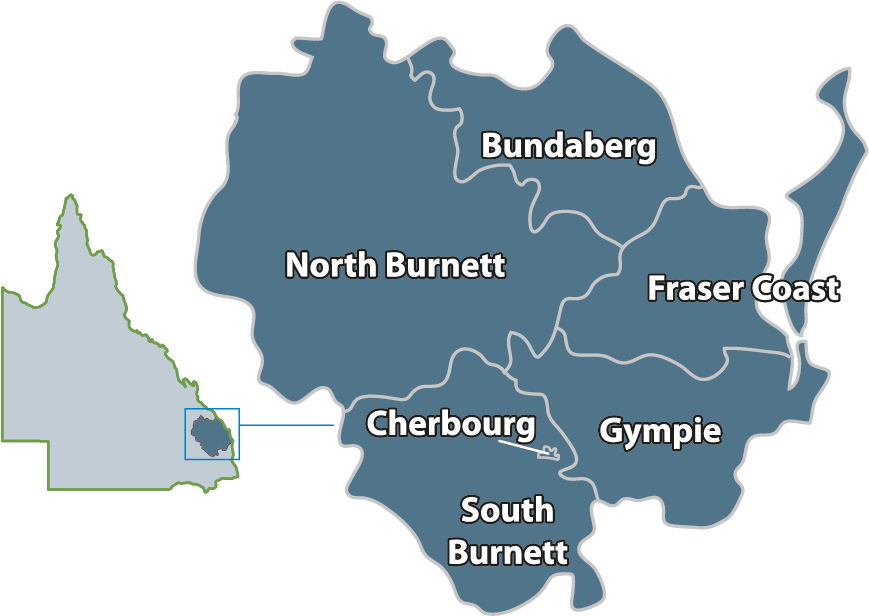
Click on local area for detailed information
Economic performance of the Wide Bay-Burnett region can be measured using 10 headline indicators (or (EPIs)
collapsed expanded Population
289,196 persons (2015)
EPI 1: Population growth
Measured by the annual % change in estimated resident population
Population Growth
Population Annual growth Average annual
growth
2015 2014-15 2010-15
Bundaberg 94,380 0.1% 0.6%
Cherbourg 1,291 0.1% 0.7%
Fraser Coast 101,977 0.7% 1.1%
Gympie 48,681 0.5% 1.0%
North Burnett 10,292 -0.1% -0.1%
South Burnett 32,575 0.0% 0.7%
Wide Bay-Burnett 289,196 0.4% 0.8%
Queensland 4,778,854 1.2% 1.6%
Australia 23,777,777 1.4% 1.5%
Source: ABS
Population Growth
collapsed expanded Gross Regional Product
$12.1 billion (2014/15)
EPI 2: Economic growth
Measured by annual change in real Gross Regional Product
EPI 3: GRP per capita
Measured by the total GRP divided by the resident population
Gross Regional Product
GRP ($M) Annual growth GRP per capita ($)
2014/15 2013/14-2014/15 2014/15
Bundaberg 3,963.1 -7.7% 41,532
Cherbourg 85.1 -5.7% 62,018
Fraser Coast 3,743.4 -10.1% 36,410
Gympie 1,978.6 -6.6% 41,145
North Burnett 671.7 0.4% 64,455
South Burnett 1,705.0 -4.7% 51,207
Wide Bay-Burnett 12,146.9 -7.4% 41,684
Queensland 296,235.0 2.2% 63,584
Australia 1,583,557.0 1.6% 68,978
Source: ABS, DEEWR, Lawrence Consulting
GRP per capita
collapsed expanded Labour Market
111,346 employed persons (Mar Qtr 2016)
EPI 4: Employment growth
Measured by the annual change in employed persons (residents)
EPI 5: Unemployment rate
Measured by total unemployed persons as % of labour force
Labour Market
Employed persons Annual growth Unemployment rate
Mar Qtr 2016 yr to Mar Qtr 2016 Mar Qtr 2016
Bundaberg 37,745 9.7% 8.8%
Cherbourg 459 10.3% 11.4%
Fraser Coast 36,235 9.8% 9.8%
Gympie 19,219 9.1% 8.5%
North Burnett 4,864 8.5% 5.1%
South Burnett 12,824 9.6% 8.4%
Wide Bay-Burnett 111,346 9.6% 8.9%
Queensland 2,356,413 1.3% 6.2%
Australia 11,809,846 2.0% 6.0%
Source: DEEWR, Lawrence Consulting
Unemployment Rate
collapsed expanded Productivity
$59.23 value added/hr worked (2014/15)
EPI 6: Productivity
Measures the efficiency of production within a region by dividing the total value added/GRP by employee hours worked (i.e. labour productivity)
Productivity
Productivity level Annual change ($) Annual growth (%)
2014/15 2013/14-2014/15 2013/14-2014/15
Bundaberg $59.28 -$2.21 -3.6%
Cherbourg $44.36 -$0.67 -1.5%
Fraser Coast $60.03 -$2.94 -4.7%
Gympie $62.36 -$1.62 -2.5%
North Burnett $63.74 $1.66 2.7%
South Burnett $70.43 $1.38 2.0%
Wide Bay-Burnett $59.23 -$1.88 -3.1%
Queensland $62.92 -$0.10 -0.2%
Australia $81.55 $1.10 1.4%
Source: ABS, Lawrence Consulting
Labour Productivity
collapsed expanded Economic Diversity
0.736 (2011)
EPI 7: Index of Economic Diversity
Measures economic diversity within a region by determining the degree to which the region’s industry mix differs from that of the nation. When the index value is close to one, the industrial profile of a region mirrors that of the national economy and is considered more diverse
Economic Diversity
Index value Index value
(Australia = 1.000) (Queensland = 1.000)
Bundaberg 0.725 0.749
Cherbourg 0.249 0.250
Fraser Coast 0.768 0.785
Gympie 0.592 0.599
North Burnett 0.173 0.189
South Burnett 0.482 0.555
Wide Bay-Burnett 0.736 0.764
Queensland 0.980 1.000
Australia 1.000 -
Source: ABS
Index of Economic Diversity
collapsed expanded Building Activity
1,541 dwelling approvals (yr to Mar Qtr 2016)
EPI 8: Growth in dwelling approvals
Measured by annual % change in total dwelling approvals
Building Activity
Dwelling approvals Annual growth Value of non-residential approvals ($'000) Annual growth
yr to Mar Qtr 2016 yr to Mar Qtr 2016 yr to Mar Qtr 2016 yr to Mar Qtr 2016
Bundaberg 431 -4.6% 68,072 -28.4%
Cherbourg 0 0.0% 0 -100.0%
Fraser Coast 699 11.7% 53,806 -20.7%
Gympie 318 27.7% 58,386 214.9%
North Burnett 26 23.8% 2,022 75.4%
South Burnett 67 -20.2% 12,240 10.5%
Wide Bay-Burnett 1,541 7.6% 194,526 0.2%
Queensland 46,306 11.9% 6,284,207 21.9%
Australia 219,315 6.1% 29,733,685 -0.8%
Source: ABS
Dwelling Approvals
collapsed expanded Business Numbers
21,348 businesses (June 2015)
EPI 9: Average business turnover
Measured by the average turnover of entities whose registered place of business for GST is within the region
Local Business Turnover
Business count Annual growth Estimated local business turnover ($M) Average business turnover ($'000)
June 2015 yr to June 2015 2014/15 2014/15
Bundaberg 6,502 -0.5% 2,681 412.3
Cherbourg 130 -1.5% 37 286.3
Fraser Coast 5,718 -0.5% 2,246 392.8
Gympie 4,272 -1.2% 1,484 347.3
North Burnett 1,672 -2.0% 588 351.7
South Burnett 3,054 -2.0% 934 306.0
Wide Bay-Burnett 21,348 -1.0% 7,970 373.3
Queensland 410,847 0.2% 172,521 419.9
Australia 2,095,698 1.2% 884,887 422.2
Source: ABS, Lawrence Consulting
Average Business Turnover
collapsed expanded Income
$20,463 per capita (2012/13)
EPI 10: Per capita income
Measured by total income based on ATO returns divided by estimated resident population
Personal Income
Per capita income Annual growth Average annual growth
2012/13 2011/12-2012/13 2007/08-2012/13
Bundaberg $22,254 6.7% 4.9%
Cherbourg $5,600 -33.9% -15.0%
Fraser Coast $19,894 6.9% 4.0%
Gympie $19,859 7.1% 4.1%
North Burnett $18,205 0.5% 2.3%
South Burnett $19,248 3.8% 3.5%
Wide Bay-Burnett $20,463 6.2% 4.1%
Queensland $30,596 6.3% 4.1%
Australia $31,968 5.1% 4.1%
Source: ABS, Lawrence Consulting
Per capita income
Click on arrow to expand. Hover over data points in interactive graphs for actual values.