TOOWOOMBA AND SURAT BASIN

Toowoomba and Surat Basin Map WesternDowns Toowoomba
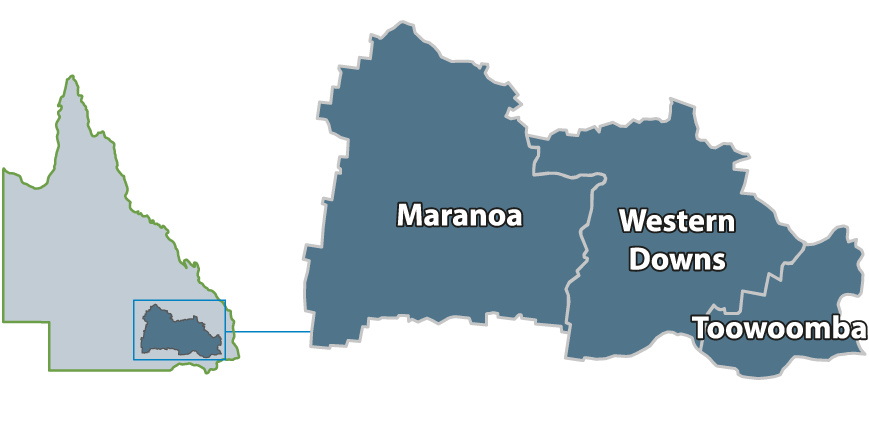
Click on local area for detailed information
Economic performance of the Toowoomba and Surat Basin region can be measured using 10 headline indicators (or (EPIs)
collapsed expanded Population
209,485 persons (2014)
EPI 1: Population growth
Measured by the annual % change in estimated resident population
Population Growth
Population Annual growth Average annual
growth
2014 2013-14 2009-14
Maranoa 13,862 0.6% 1.1%
Toowoomba 161,970 1.1% 1.2%
Western Downs 33,653 0.7% 1.7%
Toowoomba and Surat Basin 209,485 1.0% 1.3%
Queensland 4,722,447 1.5% 1.8%
Australia 23,490,736 1.6% 1.6%
Source: ABS
Population Growth
collapsed expanded Gross Regional Product
$14.0 billion (2013/14)
EPI 2: Economic growth
Measured by annual change in real Gross Regional Product
EPI 3: GRP per capita
Measured by the total GRP divided by the resident population
Gross Regional Product
GRP ($M) Annual growth GRP per capita ($)
2013/14 2012/13-2013/14 2013/14
Maranoa 1,558.2 9.4% 112,690
Toowoomba 9,255.4 0.6% 57,601
Western Downs 3,204.8 8.5% 94,738
Toowoomba and Surat Basin 14,018.4 3.2% 67,257
Queensland 296,235.0 2.3% 63,361
Australia 1,583,557.0 2.5% 67,415
Source: ABS, DEEWR, Lawrence Consulting
GRP per capita
collapsed expanded Labour Market
97,323 employed persons (Jun Qtr 2015)
EPI 4: Employment growth
Measured by the annual change in employed persons (residents)
EPI 5: Unemployment rate
Measured by total unemployed persons as % of labour force
Labour Market
Employed persons Annual growth Unemployment rate
Jun Qtr 2015 yr to Jun Qtr 2015 Jun Qtr 2015
Maranoa 7,983 -6.6% 2.1%
Toowoomba 72,470 -4.7% 5.0%
Western Downs 16,870 -7.2% 3.8%
Toowoomba and Surat Basin 97,323 -5.3% 4.5%
Queensland 2,332,008 0.5% 6.5%
Australia 11,671,495 1.5% 6.1%
Source: DEEWR, Lawrence Consulting
Unemployment Rate
collapsed expanded Productivity
$63.06 value added/hr worked (2013/14)
EPI 6: Productivity
Measures the efficiency of production within a region by dividing the total value added/GRP by employee hours worked (i.e. labour productivity)
Productivity
Productivity level Annual change ($) Annual growth (%)
2013/14 2012/13-2013/14 2012/13-2013/14
Maranoa $69.12 $1.97 2.9%
Toowoomba $60.02 $0.46 0.8%
Western Downs $68.57 $1.67 2.5%
Toowoomba and Surat Basin $63.06 $1.02 1.6%
Queensland $62.19 $0.56 0.9%
Australia $79.05 $1.47 1.9%
Source: ABS, Lawrence Consulting
Labour Productivity
collapsed expanded Economic Diversity
0.737 (2011)
EPI 7: Index of Economic Diversity
Measures economic diversity within a region by determining the degree to which the region’s industry mix differs from that of the nation. When the index value is close to one, the industrial profile of a region mirrors that of the national economy and is considered more diverse
Economic Diversity
Index value Index value
(Australia = 1.000) (Queensland = 1.000)
Maranoa 0.258 0.424
Toowoomba 0.844 0.897
Western Downs 0.331 0.374
Toowoomba and Surat Basin 0.737 0.776
Queensland 0.980 1.000
Australia 1.000 -
Source: ABS
Index of Economic Diversity
collapsed expanded Building Activity
1,528 dwelling approvals (yr to Jun Qtr 2015)
EPI 8: Growth in dwelling approvals
Measured by annual % change in total dwelling approvals
Building Activity
Dwelling approvals Annual growth Value of non-residential approvals ($'000) Annual growth
yr to Jun Qtr 2015 yr to Jun Qtr 2015 yr to Jun Qtr 2015 yr to Jun Qtr 2015
Maranoa 56 -34.1% 11,001 -49.4%
Toowoomba 1,338 -91.3% 281,119 56.4%
Western Downs 134 -72.7% 83,718 38.6%
Toowoomba and Surat Basin 1,528 -19.9% 375,838 43.5%
Queensland 43,131 15.5% 5,453,519 -12.3%
Australia 213,616 14.0% 28,854,201 -17.3%
Source: ABS
Dwelling Approvals
collapsed expanded Business Numbers
22,117 businesses (June 2014)
EPI 9: Average business turnover
Measured by the average turnover of entities whose registered place of business for GST is within the region
Local Business Turnover
Business count Annual growth Estimated local business turnover ($M) Average business turnover ($'000)
June 2014 yr to June 2014 2013/14 2013/14
Maranoa 2,576 5.4% 1,087 422.0
Toowoomba 14,639 2.1% 6,048 413.2
Western Downs 4,902 1.9% 2,231 455.2
Toowoomba and Surat Basin 22,117 2.4% 9,367 423.5
Queensland 409,936 0.8% 168,280 410.5
Australia 2,070,189 1.2% 847,340 409.3
Source: ABS, Lawrence Consulting
Average Business Turnover
collapsed expanded Income
$23,516 per capita (2010/11)
EPI 10: Per capita income
Measured by total income based on ATO returns divided by estimated resident population
Personal Income
Per capita income Annual growth Average annual growth
2010/11 2009/10-2010/11 2005/06-2010/11
Maranoa $24,642 20.9% 5.9%
Toowoomba $23,440 6.0% 4.5%
Western Downs $21,674 12.6% 5.9%
Toowoomba and Surat Basin $23,516 8.3% 4.7%
Queensland $27,090 7.1% 5.0%
Australia $28,957 8.5% 5.0%
Source: ABS, Lawrence Consulting
Per capita income
Click on arrow to expand. Hover over data points in interactive graphs for actual values.