

SOUTH BURNETT
Economic performance of a region can be measured using 10 headline indicators (or EPIs):
Key Economic Performance Indicators (EPIs)
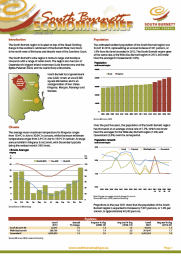
 Population
 Population
32,575 persons
(2015)

 Gross Regional Product
$1.7 billion
(2014/15)
Labour Market
12,824 employed persons
(Mar Qtr 2016)
Productivity
$70.43 value added/hr worked
(2014/15)
Economic Diversity
0.482
(2011)
Building Activity
67 dwelling approvals
(yr to Mar Qtr 2016)
Business Numbers
3,054 businesses
(June 2015)
Income
$19,248 per capita
(2012/13)
Click on arrow to expand. Hover over data points in interactive graphs for actual values.
LGA Performance Ratings

| South Burnett | |||
|---|---|---|---|
| Period | Level | Rating | |
| EPI 1: Population growth | 2015 | 0.0% |

|
| EPI 2: Economic growth | 2014/15 | -4.7% |
|
| EPI 3: GRP per capita | 2014/15 | $51,207 |
|
| EPI 4: Employment growth | yr to Mar Qtr 2016 | 9.6% |
|
| EPI 5: Unemployment rate | Mar Qtr 2016 | 8.4% |

|
| EPI 6: Productivity level | 2014/15 | $70.43 |
|
| EPI 7: Index of Economic Diversity | 2011 | 0.482 |
|
| EPI 8: Growth in dwelling approvals | yr to Mar Qtr 2016 | -20.2% |
|
| EPI 9: Average business turnover | 2014/15 | $305,959 |
|
| EPI 10: Per capita income | 2012/13 | $19,248 |
|
| Average performance rating |
|


© Lawrence Consulting
LGA Performance Ratings are exclusively compiled by Lawrence Consulting and measure the comparative performance of a local government area against the 558 LGAs within Australia.
The ratings use a 5-star scale, where one star is equivalent to the 20th percentile (i.e. within the lower 20 percent of LGAs for a single measure)